Why Economic Activity Does Not Guarantee Value Creation: The B.I.G.o Framework and the National Index of Circulation (NIC)
Nikoloz Abuashvili, PhD
Professor
Georgian Institute of Public Affairs
Tbilisi, Georgia
Abstract: This paper develops the B.I.G.o. (Business–Individuals–Government–Outside) framework as a simplified representation of the economic system, designed to trace how monetary flows circulate and generate value within an economy. Within this framework, we introduce the National Index of Circulation (NIC) as a simplified metric capturing the efficiency with which economic activity is transformed into domestic value added.
While conventional multiplier analysis mostly focuses on the magnitude of induced turnover, it does not distinguish between circulation that is retained within the domestic system and that which leaks through external channels. The B.I.G.o. framework addresses this limitation by decomposing economic propagation across core actors and by enabling a distinction between turnover (scale) and value capture (efficiency), formalized through NIC.
Using a multi-country panel dataset for 2011–2021, we compute injection-specific multipliers and NIC values for business-, household-, and government-originated scenarios. The results reveal substantial cross-country heterogeneity in circulation efficiency, with systematic divergences between high-turnover and high-efficiency economies.
Overall, the findings demonstrate that embedding efficiency metrics such as NIC within a structural circulation framework provides a more informative basis for macroeconomic analysis and policy design, particularly in open economies where leakage effects are significant.
Keywords: National Index of Circulation; Value Retention; Social Accounting Matrix; Circulation Efficiency; Policy Simulation; Domestic Value Added.
Introduction
A central question in development and structural economics concerns why economies generating similar levels of economic activity often exhibit markedly different capacities to retain value domestically.
Consider the practical problem facing a minister of finance choosing between two initiatives of equal budget: a household transfer and a public-investment program. Conventional appraisal tells the ministry how much economic activity each will stimulate, but not how much of that activity will be retained domestically as value added rather than dissipating through imports or low-value circulation. The two can diverge sharply: an initiative that generates large gross turnover may leave comparatively little value behind, while a smaller one may retain more. Answering this second question requires a measure that is defined not for an economy as a whole, but for a specific injection i.e. the particular mix of households, government, and productive activities through which a policy’s spending enters the system. The framework developed in this paper provides such a measure, and the closing simulation demonstrates its use directly.
Comparative analysis of national economies provides an important means of identifying structural differences in economic organization, value creation, and development trajectories. Existing measures provide valuable information regarding either economic scale (GDP, output, turnover) or value-added content. However, they offer limited insight into how efficiently economic circulation propagates through domestic institutional structures and translates into retained value. This suggests the need for analytical tools and metrices that differentiate between the economic activity volume and the scale at which that activity translates into domestically retained value.
This paper introduces the B.I.G.o. framework that provides a complementary perspective by focusing on the internal circulation of monetary flows within the economy. Building on Leontief’s conception of the economy as a system of interdependent industries and the subsequent Social Accounting Matrix tradition emphasizing transactions among institutional agents (Pyatt & Round, 1985).
Within the B.I.G.o framework, economic activity is modeled as a recursive process of income redistribution among main actors in the system, namely Businesses, Individuals, Government, and Outside World. The analysis distinguishes between turnover, defined as the total volume of monetary circulation generated by an initial injection, and value capture, defined as the share of that circulation retained as domestic value added. The framework provides decomposition of economic circulation by institutional actors combined with value capture diagnostics.
The paper also introduces the National Index of Circulation (NIC), defined as the ratio of value-added generation to circulation intensity. The NIC is conceptually related to value-added multipliers and domestic value-retention measures derived from input-output frameworks. While value-added multipliers quantify the absolute amount of value generated by an initial injection, they do not normalize value generation by the intensity of circulation itself. Consequently, economies exhibiting similar value-added multipliers may differ substantially in their efficiency of value retention. The NIC measures the efficiency with which circulation is transformed into domestically retained value. By construction, it separates circulation scale from circulation efficiency, allowing economies with similar levels of activity to be compared according to their capacity to retain value within domestic economic networks.
The contribution of this paper is fourfold. First, it introduces the B.I.G.o. framework as a simplified representation of economic circulation among institutional actors. Second, it develops the National Index of Circulation (NIC) as a measure of circulation efficiency and domestic value retention. Third, it provides empirical evidence on cross-country variation in circulation efficiency and examines its temporal association with economic performance. Fourth, it demonstrates the framework’s use as an ex-ante decision tool through a policy simulation that ranks stylized initiatives by value retention, showing that activity-maximizing and value-maximizing policies need not coincide.
The empirical analysis applies this framework to a cross-country dataset to reveal systematic variation in circulation intensity and value capture. The empirical contribution is accordingly presented at three levels of confidence: structural benchmarking of circulation efficiency across countries, a policy simulation demonstrating the framework’s diagnostic use, and a more tentative panel analysis of whether changes in circulation efficiency are associated with subsequent growth.
Literature Review
Comparative analysis is the systematic process of comparing key economic indicators across countries, regions, or industries to assess relative performance. In today’s globalized economy, it is indispensable for guiding economic policy decisions, fostering competition, and enhancing a country’s position in global value chains. Comparative analysis of economic systems helps policymakers (to name few):
- Assess Competitiveness: By comparing performance indicators such as productivity, innovation capacity, and export performance, countries can identify areas of strength and potential for improvement.
- Identify Policy Gaps: Benchmarking can reveal inefficiencies or underperformance in key sectors, prompting reforms in industrial policy, innovation support, or labor markets.
- Enhance Policy Learning: By examining the policy approaches of other countries, governments can adopt best practices, avoiding costly missteps in policy implementation (Porter, 1990).
- Track Progress: Policymakers can use benchmarking to evaluate the effectiveness of previous reforms and policies, adjusting strategies to ensure sustained economic growth (OECD, 2021).
For emerging economies such as Georgia, comparative analysis is crucial for identifying in which area the country could be competitive globally, while in advanced economies benchmarking might focuses on maintaining leadership in innovation and sustainability. In transition economies it can guide their integration into global markets and help prioritize sectors for investment.
Types of Economic Models for comparison
Comparison studies are based on several families of economic models, each capturing part of the picture but none separating the volume of circulation from the efficiency with which it is retained as domestic value. Macroeconomic models (IS-LM, AD-AS) relate aggregates such as output, inflation, and fiscal balances and underpin most cross-country comparison of growth and stability (Blanchard & Johnson, 2013), but they operate above the level of inter-actor flows and so cannot distinguish an economy that circulates value efficiently from one that merely transacts heavily. Microeconomic models address firm and household behavior, market structure, and welfare (Tirole, 2017), but at a level of disaggregation that does not aggregate into a system-wide measure of retained value. Computable general equilibrium models combine both and simulate how economies adjust to shocks such as trade or tax reforms (Walmsley & Minor, 2020), yet their focus is the new equilibrium reached, not the share of an injection retained domestically as it propagates. Agent-based models build macro patterns bottom-up from interacting agents (Tesfatsion & Judd, 2006), offering dynamic richness at the cost of computational and calibration burden, and are likewise oriented to emergent behavior rather than value retention. Multiplier models, closest in spirit to the present framework, trace the cascading effect of an initial change in spending on total output (Keynes, 1936), but by design they measure the magnitude of induced activity and stop short of asking how much of that activity is captured as domestic value rather than lost to leakage.
Key Indicators for Economic Benchmarking
Cross-country economic benchmarking traditionally relies on a well-established dashboard of macroeconomic indicators. Gross Domestic Product (GDP), Labor Productivity, and Total Factor Productivity (TFP) remain the standard metrics for assessing aggregate output and input efficiency (OECD, 2021). Furthermore, advanced benchmarking incorporates innovation metrics (such as R&D expenditure and patent density) and environmental sustainability indices to capture long-term economic resilience (Stern, 2006). However, while these static indicators excel at measuring absolute output and generalized efficiency, they often fail to capture the dynamic flow of capital between distinct domestic actors.
Methodologies for Comparing Economic systems
Several methodologies are commonly employed to benchmark the economic performance of different countries. These methods offer different insights depending on the data available and the specific goals of the analysis.
Input-Output Analysis
Input-Output (I-O) analysis, introduced by Wassily Leontief, examines how industries within an economy are interconnected through their production and consumption of goods and services. This method is especially valuable for countries, which rely heavily on industrial sectors with complex supply chains. I-O analysis helps policymakers assess how changes in one industry, such as steel manufacturing, affect the wider economy (Leontief, 1986). For Georgia, I-O analysis can be used to evaluate how tourism and agriculture contribute to economic diversification, while the Czech Republic employs it to understand the linkages between its automotive and electronics sectors.
Regression Analysis
Regression analysis is a statistical method used to quantify relationships between variables, such as the impact of government spending on GDP growth or the influence of education levels on labor productivity. In benchmarking, regression models can be used to isolate key drivers of growth or to evaluate the effectiveness of specific policy measures. For example, Finland uses regression analysis to study the relationship between R&D investment and its strong performance in high-tech exports (Wooldridge, 2010).
Data Envelopment Analysis (DEA)
DEA is a non-parametric method that evaluates the efficiency of decision-making units, such as countries or regions, in converting inputs (such as labor and capital) into outputs (such as GDP or productivity gains). DEA is commonly used in cross-country benchmarking studies to compare the efficiency of public sector’s performance in areas such as healthcare, education, and infrastructure (Charnes, Cooper, & Rhodes, 1978). Hungary and Portugal, which have reformed their healthcare systems, often apply DEA to assess public sector efficiency.
Measuring Economic Performance Beyond Aggregate Output
The measurement of economic performance has traditionally relied on aggregate indicators such as Gross Domestic Product (GDP) and related national accounting metrics. While these measures provide a comprehensive assessment of economic activity, they offer limited insight into the structural processes through which value is generated and distributed within the economy. As emphasized by Stiglitz et al. what is measured affects what is done that underscores the importance of aligning measurement frameworks with the underlying dynamics of economic systems. (Stiglitz, Sen, & Fitoussi, 2009)
A growing body of literature has therefore highlighted the limitations of GDP as a standalone indicator, particularly in capturing issues related to distribution, sustainability, and structural efficiency. However, less attention has been paid to the internal circulation of economic activity, and the extent to which such circulation translates into domestically retained value.
Input-Output and Social Accounting Matrix Approaches
The foundations for analyzing economic interdependencies were established back in 1951 by Leontief who conceptualized the economy as a system of interdependent industries and interrelated regions. Input-output models provide a framework for tracing the flow of goods and services across sectors, enabling the estimation of multiplier effects arising from changes in final demand. (Leontief, 1986)
Social Accounting Matrix (SAM) approaches extend this framework by incorporating institutional sectors and income flows. As noted by Pyatt and Round, SAMs explicitly represent “transactions between agents,” allowing for a more comprehensive analysis of the circular flow of income. (Pyatt & Round, 1985)
Building on the SAM foundation, a substantial literature has developed methods to decompose SAM multipliers into economically interpretable channels. Stone’s accounting multipliers (Pyatt & Round, 1985) and the decomposition introduced by Defourny and Thorbecke partition the total multiplier effect of an injection into transfer effects (direct redistribution), open-loop or cross-effects (spillovers between distinct institutional groups), and closed-loop effects (income circulating back to its origin through the full system) (Defourny & Thorbecke, 1984). A closely related strand extends the Leontief system to capture income-distribution feedback explicitly: Miyazawa’s inter-relational income multipliers (Miyazawa, 1976) embed the distribution of income across groups and their corresponding consumption patterns within an integrated multiplier framework. The B.I.G.o model is, structurally, a compact SAM multiplier system over three institutional actors, and its turnover multiplier summarizes the same propagation that this decomposition literature disaggregates. The contribution of the present paper is therefore not the propagation accounting itself, which is well established, but its normalization into an efficiency ratio: whereas multiplier decomposition characterizes how an injection circulates, the National Index of Circulation asks how much of that circulation is retained as domestic value added per unit of gross flow, and — unlike a single economy-wide multiplier — does so separately for each injection point. It is this volume-versus-retention ratio, evaluated at a specified entry point, that distinguishes NIC from the decomposition measures it builds upon.
These approaches have been widely used to analyze the propagation of economic activity and the distributional effects of shocks (Thorbecke, 2000). However, their primary focus has been on the magnitude of multiplier effects, rather than on distinguishing between the volume of circulation and the efficiency with which such circulation generates domestic value added.
Global Value Chains and the Geography of Value Capture
Literature on global value chains (GVCs) has emphasized the fragmentation of production across national borders. Baldwin observes that goods are no longer made in one place reflecting the increasing spatial separation of production stages (Baldwin, 2016). This fragmentation has important implications for the measurement of economic performance. The OECD Trade in Value Added (TiVA) framework highlights that gross trade figures can be misleading as they fail to account for the origin of value added embodied in traded goods and services. (OECD, 2022). As a result, countries may exhibit high levels of trade or output while capturing only a limited share of the underlying value.
Within this literature, a strand of work has formalized precisely the distinction between gross flows and retained value that motivates the present study. (Johnson & Noguera, 2012) introduce the ratio of value added to gross exports as a measure of how much domestic value is embodied in a country’s trade, and (Koopman, Wang, & Wei, 2014) provide a complete decomposition of gross exports into domestic and foreign value-added components. These measures are conceptually the closest existing relatives of the National Index of Circulation: each is a ratio that separates the magnitude of a gross flow from the share of it retained as domestic value. The difference is one of domain and entry point. The export-based ratios are defined on trade flows and answer how much value a country captures from its participation in international production networks; the NIC is defined on internal circulation and answers how much value an economy retains from an injection at a specified domestic entry point — household consumption, government consumption, or a particular productive activity. NIC thus extends the gross-versus-retained logic of the value-added-in-trade literature from the external, trade-flow margin to the internal, injection-specific margin.
While the GVC literature provides important insights into the external dimension of value creation, it does not fully address how economic activity circulates within domestic systems, nor how internal structures influence the retention of value.
The Missing Link: Circulation Versus Value Capture
Put together, these strands of literature point to an important gap. Input-output and SAM approaches provide tools for analyzing the propagation of economic activity, while GVC frameworks highlight the distinction between production and value capture at the global level. However, neither framework explicitly distinguishes between the total volume of monetary circulation generated within an economy, and the share of that circulation that is retained (i.e. captured) as domestic value added.
This distinction is critical for understanding the structural effectiveness of economic systems. Economies may exhibit high levels of activity due to extensive transaction chains but retain only a limited share of value due to leakages through imports or external payments. Conversely, economies with more limited circulation may achieve higher levels of value retention.
The present paper addresses this gap by introducing a framework that explicitly separates these two dimensions and integrates them into a composite measure—the National Index of Circulation (NIC). In doing so, it provides a complementary perspective that links internal economic structure with value capture outcomes.
Methodology
Conceptual scope
Traditional macroeconomic analysis predominantly relies on aggregate production indicators such as GDP and value added. While these measures capture the scale of economic activity, they provide limited insight into the internal circulation of economic flows and the extent to which such flows generate domestically retained value (Stiglitz, Sen, & Fitoussi, 2009).
To address this limitation, the present study introduces the B.I.G.o framework that focuses on the propagation and transformation of monetary flows within the domestic economy, rather than solely on their final outcomes.
Structural model of monetary circulation
Although our world is a closed economic system so far, the economy of each country is not. Let the economy be represented as a system of interactions among four institutional actors:
- Businesses (B)
- Individuals (I)
- Government (G)
- Outside world (o)
The model treats external economic interactions as exogenous inflows and outflows transmitted through domestic institutional actors. It does not attempt to model the determination of such flows (export demand, remittance inflows, or similar) but rather focuses on how they are absorbed and transformed within the domestic economy through institutional interactions. In this sense, the model captures the internal propagation mechanism of economic activity, regardless of its ultimate origin.
However, because the outside world does not reinject spending in the current model, it is treated as exogenous and enters the system through injections and leakages. Therefore, the active domestic system is:

The propagation of available funds is governed by the matrix:
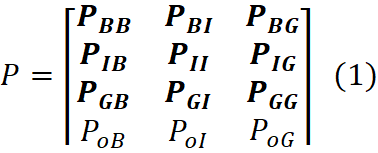
Where:
: the share of actor
‘s revenue spent on actor
. Each column is an actor’s spending profile (how that actor allocates its outlays); each row shows the sources of respective actor’s income.
Thus, leakages are defined as:

These consist of:
- Imports
- Any other flows leaving the system
Savings are defined as:

These consist of:
- Savings
- Other flows that remain within the system but not ”consumed” within the current cycle (such as capital formation and others), however can be “consumed” in subsequent cycles.
Let
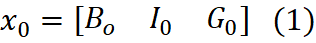
Represent the initial injection.
So, total income satisfies the accounting identity:

where:
: recirculated income generated within the system
: exogenous injection vector, capturing flows originating outside the system (e.g., exports, foreign transfers, or autonomous fiscal spending)
Solving:
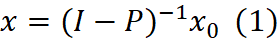
Define:
Where:
: identity matrix[1]
- 𝑀: is the circulation multiplier matrix, each element
of 𝑀 captures the total income received by actor 𝑖 as a result of a unit exogenous injection into actor 𝑗
Thus:
- Columns of 𝑀: full propagation of injections
- Rows of 𝑀: distribution of resulting income across actors
This formulation yields injection-specific turnover multipliers.
Turnover (Gross Circulation)
We define turnover as total monetary flows generated within the system, without regard to whether they constitute new value. Thus actor-level turnover is the sum of all propagated flows originating from all injection sources that can be expressed as:
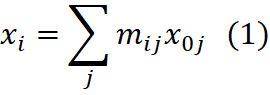
So, aggregate turnover will be the sum of all income generated in the system:

Where:
: summation vector[2]
This measure captures gross monetary circulation, including intermediate transactions.
Value Creation: Production-Based Definition
The model measures value the way national accounts do: as the value added of productive activity, namely output net of the inputs consumed in producing it. Value added arises wherever goods or services are actually produced, whether by businesses, by households in their productive capacity, or by government, and not from transfers or other payments that merely move money between actors.
When money is injected into the economy, it circulates among Businesses, Individuals, and Government, and in doing so it sets various productive activities in motion. The total value created by an injection is the sum of the value added of all the activities it activates:
Because different injections set different activities in motion (a government-originated injection follows a different path than a business- or household-originated one) the total value created depends on where the injection enters the economy. This is the feature the framework is built to capture: not just how much money circulates, but how much real value that circulation leaves behind.
Multipliers and National Index of Circulation (NIC)
The framework evaluates the effect of an injection at any injection point in the economy. An injection point is either households’ final consumption (I), government’s final consumption (G), or an individual productive activity (a sector or industry) a. Each productive activity functions as an actor in the system with its own circulation path. For any injection point s, an injection propagates through the system, generating gross circulation
from (10) and domestic value added
from (11).
For each injection point we define two multipliers relative to the size of the injection:
The turnover multiplier measures the total gross circulation generated per unit injected; the value multiplier
measures the domestic value added generated per unit injected. The National Index of Circulation for injection point
is their ratio, in which the injection scale cancels:

is the domestic value added retained per unit of gross circulation set in motion by an injection at
. It is not sensitive to the scale of the injection (multiplying
by any positive constant leaves
unchanged) but it depends on the direction of the injection, i.e. on where the money enters the economy. This direction-dependence is the property the framework is built to exploit: the same economy converts injections into retained value with different efficiency depending on their entry point.
The household- and government-originated indices, and
, are obtained directly from (12) and (13) using a unit injection at the corresponding final-consumption node,
and
. The activity-level indices
, are obtained the same way, with the injection entering activity
; they are reported in full in Annex 2. Reporting these indices gives partial view of different activities (a.k.a. sectors/industries) efficiency but does not capture business sector’s value-retention efficiency as the economy is actually configured. So, we summarize them in a single business figure by output-weighting the activity-level multipliers, using each activity’s observed output
in the relevant year:

The output weights are the activities’ observed shares in the current year because
is intended to measure the efficiency with which the business sector converts injections into retained value given the economy’s present structure: activities enter weighted by their actual economic significance rather than as if uniform, so a high-efficiency activity that is a small share of output counts for less than a moderate-efficiency activity that dominates production. An unweighted average of activity-level indices would answer a counterfactual question (efficiency in a structurally uniform economy) that is not the one a policymaker asks. The current-year weighting is therefore what makes
the economically relevant aggregate. By the same logic, the cross-country comparisons that follow compare each economy’s business sector (as it is actually configured); the resulting indices are comparable as structure-inclusive measures of value retention, which is the matter of interest.
Two technical features should nonetheless be made explicit. First, is a ratio of two weighted averages (not the average of the activity-level ratios
; it expresses aggregate induced value added per unit of aggregate induced turnover across business activities. Second, because the weights are recomputed each year, a change in
over time may arise either from activities becoming individually more efficient or from a shift in output composition toward higher-retention activities. For the cross-sectional benchmarking this composite is precisely the object of interest; in the dynamic panel regression, the coefficient on
should accordingly be read as the combined response to efficiency and compositional change, not to efficiency alone. Because the weights are observed in the same year as the index, this compositional channel also has a timing implication for the dynamic regression. A within-year shock that moves GDP will fall unevenly across activities and so shift the output weights
, mechanically altering
within that same year; the contemporaneous coefficient on
therefore conflates a structural association with a compositional response to the same-year shock and is not interpreted causally. This concern is specific to the contemporaneous horizon: at the lagged horizons (
to
) the prior-year structure precedes the outcome, so a subsequent growth shock cannot reshape the weights that define the regressor, and the lagged terms are correspondingly the more interpretable part of the specification. We retain current-year weights deliberately: the object of interest is each economy’s circulation efficiency as it was actually configured in a given year and relating that actual structure to actual subsequent outcomes is precisely the intended question. Holding weights fixed at a base year would substitute a counterfactual structure that did not obtain in later years, which is not the quantity the regression is designed to capture.
and
are single-injection-point indices and do not carry this compositional component; the three are reported together for comparability but are not constructed identically. Full activity-level multipliers and indices, prior to aggregation, are reported in Annex 2.
The injection-specific construction makes the framework directly usable as a decision tool. A policy initiative can be represented as an injection vector distributed across the entry points it actually targets whether it is household consumption, government consumption or one or more productive activities proportional to how the initiative’s spending enters the economy. Applying (12) and (13) to that vector yields the initiative’s own turnover multiplier, value multiplier, and the domestic value added that the initiative is expected to retain per unit of gross activity it generates.

Two initiatives with similar headline budgets may differ substantially in if they enter the economy at points with different circulation paths and value-added intensities. The framework therefore allows a policymaker to rank candidate initiatives not only by the scale of activity they stimulate (the turnover multiplier) but by the value they leave behind domestically (NIC) distinguishing expenditure that circulates widely but leaks from expenditure that is retained as domestic value added.
This is also where the index departs from a standard value-added-to-output ratio. A national VA/output ratio is a single fixed number for an economy; is defined for any injection vector, including the specific vector of a proposed policy, and varies with the entry point. It is this injection-specificity, rather than the ratio form itself, that constitutes the framework’s contribution.
NIC reflects two things at once: how much gross circulation an injection sets in motion (its turnover), and how much of that circulation is converted into domestic value added rather than passing through as intermediate or leaked flows. A low NIC means activity is amplified without much value being left behind; a high NIC means circulation is efficiently converted into retained value through productive activity whether that activity is carried out by business, households, or government.
The NIC is conceptually related to domestic value-added retention metrics derived from Leontief-type propagation systems but differs in interpretation and construction. Traditional value-added multipliers measure the absolute propagation of value creation through production networks, whereas NIC is a relative ratio of value generation to circulation intensity. More importantly, unlike a national value-added ratio (which is a single fixed figure for an economy) NIC is defined separately for each injection point and therefore varies with where funds enter the economy. It is this injection-specificity, the capacity to evaluate the entry profile of a particular policy, rather than the ratio form itself, that distinguishes the measure. NIC is intended to capture the efficiency with which an injection is converted into domestically retained value, rather than the scale of propagation, and so separates economies that generate large transaction volumes from those that convert circulation into value retention more effectively.
NIC is not sensitive to the scale of an injection: multiplying the injection at a given entry point by any positive constant leaves NIC unchanged, so the measure is unaffected by the size of the economy or the magnitude of demand. It is sensitive to the direction of the injection (variation across the household, government, and business scenarios reflects exactly this dependence on entry point) and variation across countries reflects differences in the expenditure structure and in activity-level value added rather than differences in economic scale. This ensures NIC captures structural characteristics of circulation rather than demand magnitude or economy size.
NIC should be interpreted as a structural accounting measure rather than a causal efficiency metric. It describes how observed expenditure structures transmit exogenous injections into retained value, rather than explaining why those structures take the form they do.
Data Sources
The analysis is based on a panel of 33 economies over the period 2011–2021, comprising Georgia and 32 other advanced and transition economies drawn primarily from the OECD database. Data for Georgia was obtained from the National Statistics Office of Georgia (Geostat). GDP figures are drawn from the IMF World Economic Outlook. The pooled cross-country benchmarking (Figure 1) includes every economy reporting at least one year in the window; the year-specific figures include only economies reporting the relevant year; and the dynamic panel regression, estimated in first differences, excludes economies reporting a single year only, leaving a regression sample of 32 economies. The supply and use tables of the national accounts serve as the core data source for the model; compiled to a common international standard by national statistical offices, they provide a detailed and comparable framework for tracing the production, distribution, and consumption of goods and services within each economy (UN, Department of Economic and Social Affairs, Statistics Division, 2018). Details of the mapping from these tables to the model’s actors and productive activities are given in Annex 1.
National supply and use tables are published at differing levels of detail — for instance the United States breaks production into as many as 114[3] activities and Georgia into 38 — but all sample economies report, as a common tier, the high-level ISIC/NACE breakdown of 21 productive activities. The present analysis uses this common 21-activity level throughout, so that every country is represented at identical, natively reported resolution without any country-specific aggregation. This choice concerns resolution only, not model structure: the B.I.G.o framework is not sensitive in form to the number of productive activities, since the propagation, multiplier, and circulation-index calculations are defined identically regardless of how finely production is disaggregated. The same framework therefore applies without modification at the finer national resolutions, which is the level used for country-specific project applications; the uniform 21-activity classification is adopted here solely to ensure cross-country comparability.
The panel is unbalanced: not all economies report supply and use tables for every year in the 2011–2021 window, so the number of available country-years varies across countries. Within this constraint, the panel spans a broad range of structural typologies (from a large consumption-driven advanced economy and an innovation-led Nordic model, to industrially integrated transition economies, a service-oriented Eurozone economy, and a state-influenced emerging market) allowing circulation efficiency to be compared across economies at different stages of development and with different production structures.
Key assumptions and limitations of research
There are several key assumptions that mimic the input-output analysis limitations, made to simplify the model:
- Spending profiles of players/sectors are fixed throughout spending lifecycle.
- There is no differentiation between spending and investment.
- The economics of producing a product rely on the ‘dominant sector’ assumption. It assumes that when different economic players purchase a product, the subsequent distribution of that revenue follows the fixed spending profile of the primary producing sector. While this abstraction simplifies complex, multi-tiered supply chains, it is mathematically necessary to prevent the transition matrix from expanding into computationally intractable complexity, allowing the model to successfully capture aggregate macroeconomic flows.
Several limitations should be acknowledged. First, the NIC remains a reduced-form structural indicator derived from aggregate circulation relationships and therefore does not provide direct causal identification. Second, the institutional aggregation inherent in the B.I.G.o framework necessarily abstracts from sector-level heterogeneity within national production systems. Third, while the 2011–2021 panel permits the evaluation of medium-term dynamics, longer historical horizons would be required to assess the stability of the observed relationships across multiple business cycles and structural regimes.
The B.I.G.o framework should be interpreted as a structural accounting model rather than a behavioral equilibrium model. The transition matrix represents observed expenditure shares derived from national accounts rather than optimized behavioral responses. This approach is consistent with the accounting traditions of input-output and social accounting matrix analysis, where fixed technical or expenditure coefficients provide a first-order approximation of economic structure.
Analysis
Circulation Efficiency and Value Generation
Figure 1 plots the relationship between turnover (x-axis) and value added (y-axis) across all countries over the period 2011–2021, with separate observations for business-originating, household- originating, and government- originating scenarios. The size of each data point reflects GDP per capita (PPP, international dollars).
A strong positive association between turnover and value added is evident, indicating that higher economic activity is generally associated with greater value creation. However, the dispersion around this relationship is substantial. For a given level of turnover, countries generate markedly different levels of value added, suggesting that activity alone is not sufficient to explain economic performance.
This dispersion reflects differences in circulation efficiency, which NIC is designed to capture. Economies located above the central tendency line exhibit higher value-added generation per unit of turnover, indicating more efficient internal propagation of economic activity.
The size dimension adds an important layer of interpretation. Higher-income economies tend to cluster in regions associated with higher value-added outcomes relative to turnover, suggesting that real economic development is associated with improvements in the efficiency of circulation rather than merely increases in scale.
Figure 1 Turnover – Value-added relationship
Source: OECD, Geostat, Author’s analysis
At the same time, the absence of a strict monotonic relationship indicates that high income is not mechanically tied to high turnover, reinforcing the conceptual distinction between volume (turnover multipliers) and efficiency (NIC).
Within-Scenario Dynamics
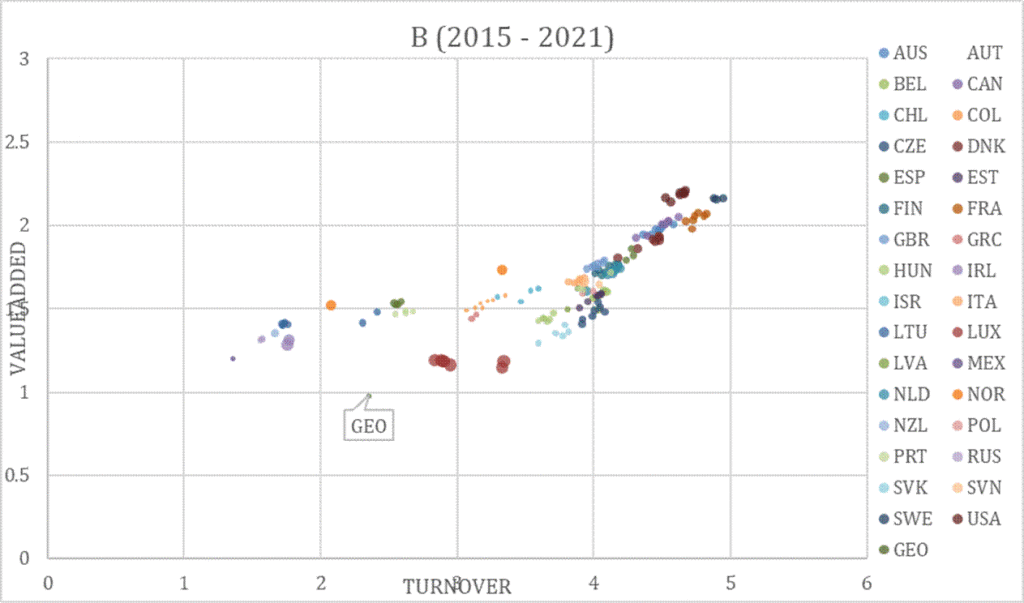
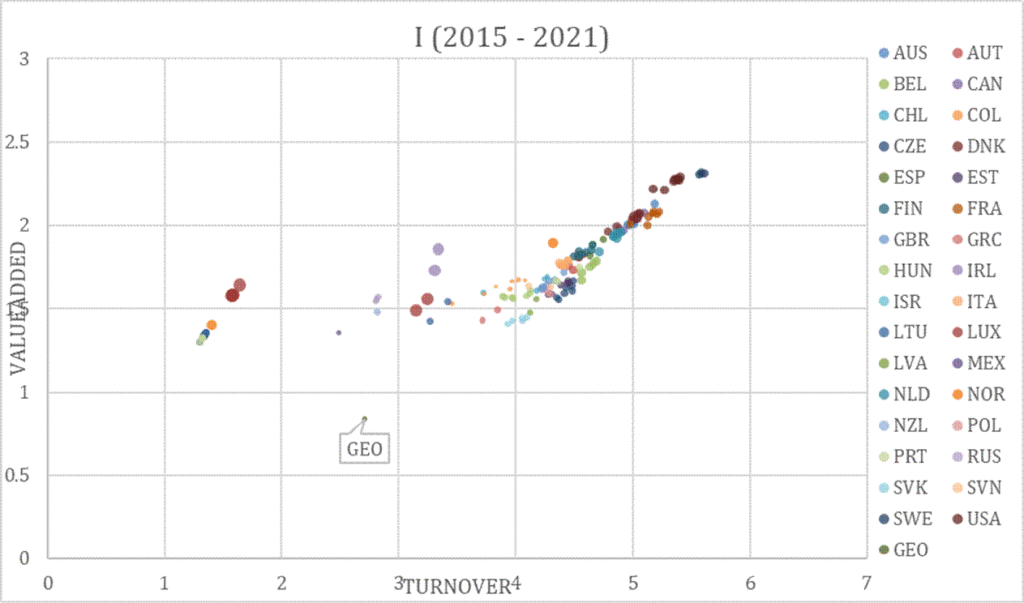
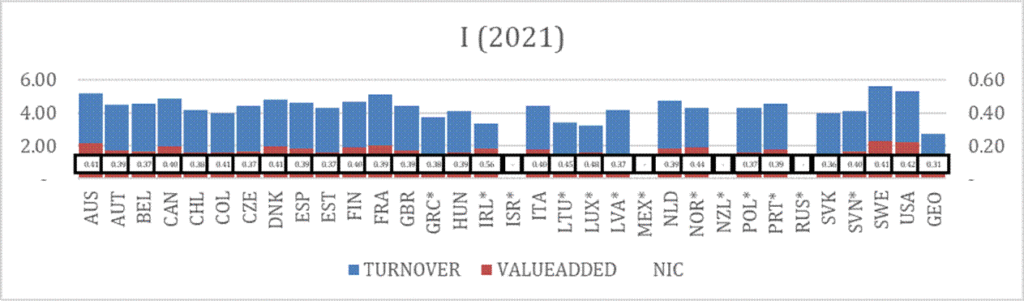
Figures 2-4 replicate the turnover–value-added relationship (Figure 1) separately for each scenario over the period 2015–2021.
Disaggregating by scenario reveals additional structure.
In the business-led scenario (Figure 2), the relationship between turnover and value added is relatively tight, indicating more predictable conversion of activity into value. This suggests that business-driven propagation mechanisms are relatively efficient and stable across countries.
Figure 2 Turnover vs Value-added benchmarking (Business-originating scenario)
In the household-led scenario (Figure 3), dispersion increases, reflecting greater heterogeneity in how consumption-driven activity translates into value creation. This is consistent with differences in domestic production structures and import leakages.
Figure 3 Turnover vs Value-added benchmarking (Household-originating scenario)
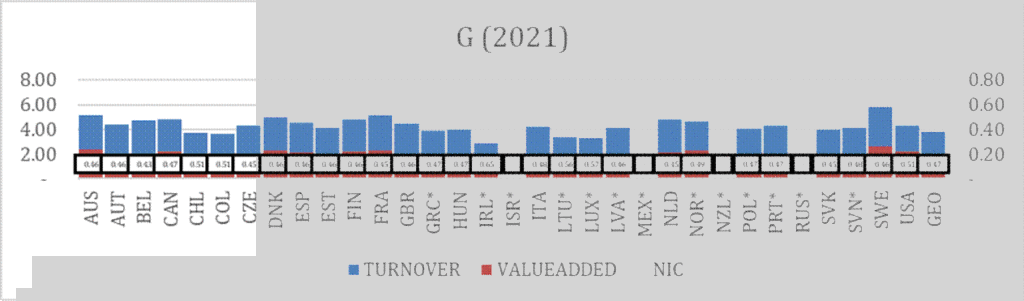
In the government-led scenario (Figure 4), dispersion is the largest. Countries with similar levels of government-induced turnover exhibit widely different value-added outcomes, indicating that public-sector propagation mechanisms are highly sensitive to institutional and structural conditions.
Figure 4 Turnover vs Value-added benchmarking (Government-originating scenario)
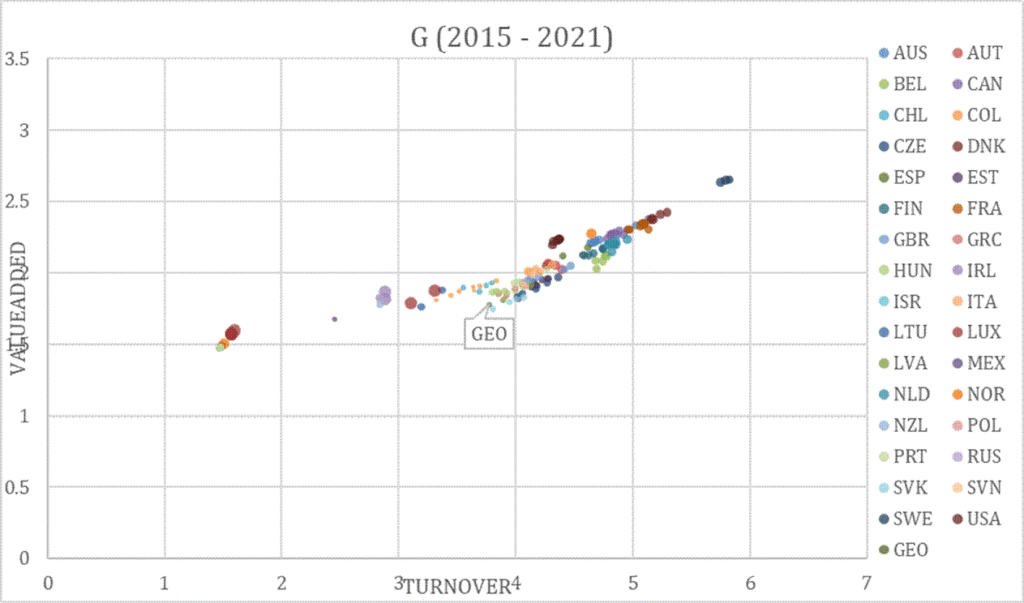
Taken together, these results reinforce the interpretation of NIC as capturing scenario-specific efficiency of circulation, rather than a purely aggregate property.
1.1. Policy Frontier: Activity vs. Efficiency Trade-offs
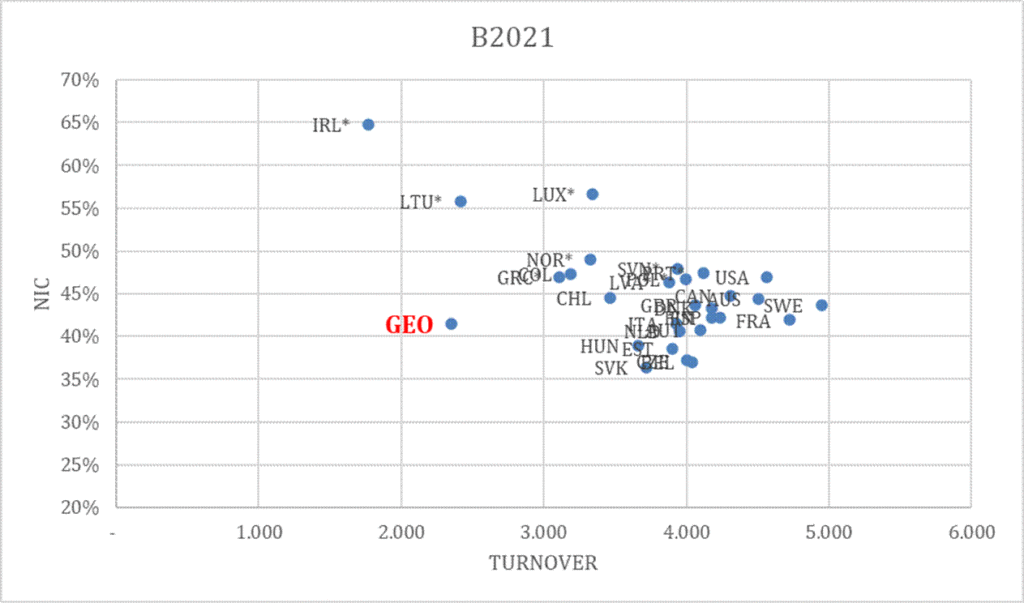
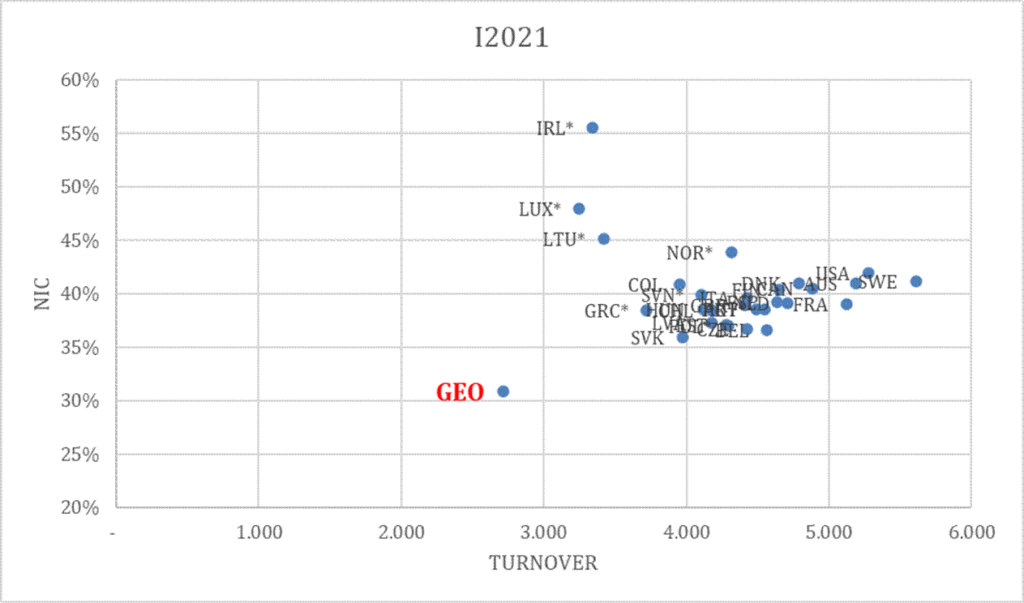
Figures 5-7 plot countries in a two-dimensional space defined by Turnover multipliers (x-axis) and NIC values (y-axis) for each scenario in 2021. These figures define a policy frontier, illustrating the trade-off between economic activity and circulation efficiency.
A key insight is that countries are not located along a single monotonic frontier. Instead, there is a clear dispersion of outcomes, indicating that higher turnover does not systematically correspond to higher NIC.
Across scenarios, several patterns emerge:
In the business-led scenario (Figure 5), countries with moderate turnover often achieve relatively high NIC, suggesting efficient value propagation even without maximal activity.
Figure 5 Turnover vs NIC (Business-originating scenario)
In the household-led scenario (Figure 6), higher turnover is more frequently associated with lower NIC, indicating that consumption-driven expansion may involve greater leakage or weaker value capture.
Figure 6 Turnover vs NIC (Household-originating scenario)
In the government-led scenario (Figure 7), the trade-off is most pronounced: some countries achieve high turnover with relatively low NIC, while others combine moderate turnover with higher efficiency.
Figure 7 Turnover vs NIC (Government-originating scenario)
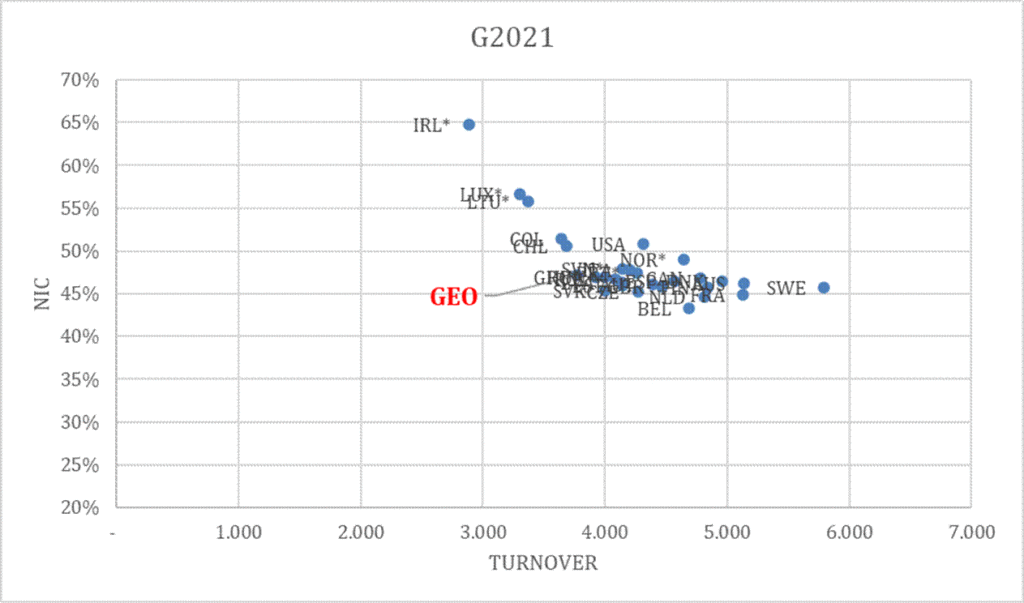
This leads to a central policy implication: policies that maximize economic activity are not necessarily those that maximize value creation efficiency.
Accordingly, optimal policy design requires balancing these two dimensions. Strategies focused solely on expanding turnover may generate short-term gains but at the cost of weaker internal value propagation.
Robustness: Pre- vs Post-Pandemic Stability
To assess whether the observed relationships are driven by pandemic-related distortions, this section compares circulation metrics across pre-pandemic (2015) and pandemic-period (2021) data.
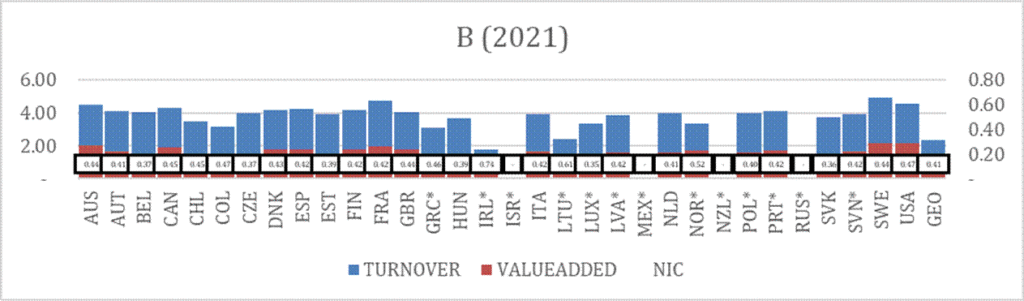
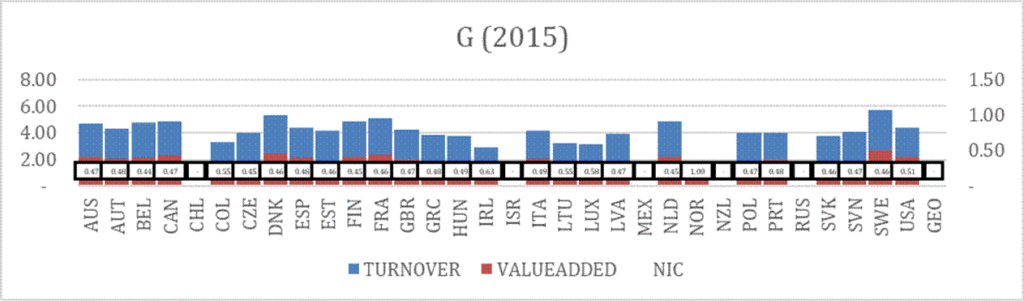
Figures 8 – 10 provide a direct comparison of turnover multipliers, value-added multipliers, and NIC values across countries for both years and for each propagation scenario (business-led, household-led, and government-led).
Figure 8 benchmarking countries (Business-originating scenario)
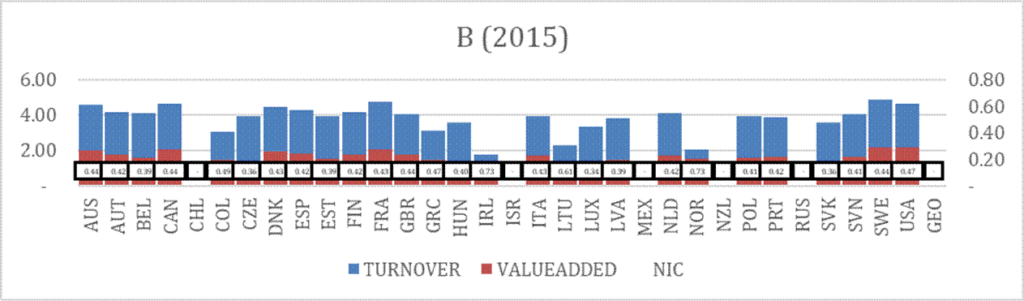
Source: OECD, Geostat, Author’s analysis
Two key findings emerge.
First, cross-country differences in NIC remain broadly stable across periods. While absolute values exhibit some variation—consistent with macroeconomic disruptions during COVID-19—the relative positioning of countries changes only marginally. Countries that exhibit high (or low) circulation efficiency in 2015 tend to retain similar positions in 2021.
Second, the qualitative relationships between turnover, value added, and NIC remain unchanged. In both periods, higher turnover does not systematically translate into higher value-added generation, and dispersion patterns across scenarios persist. In particular, government-led scenarios continue to exhibit the greatest heterogeneity, while business-led scenarios display comparatively tighter relationships.
Figure 9 Benchmarking countries (Household-originating scenario)
Source: OECD, Geostat, Author’s analysis
These findings indicate that the core empirical patterns identified in the analysis are not driven by temporary shocks but instead reflect structural characteristics of economic organization.
Accordingly, the National Index of Circulation (NIC) appears to capture persistent features of how economic activity propagates within an economy, rather than short-term fluctuations associated with crisis conditions.
Figure 10 Benchmarking countries (Government-originating scenario)
Source: OECD, Geostat, Author’s analysis
Detailed tables for the analysis are presented in Annex 2.
Policy Simulation: Activity Versus Value Retention in Practice
The analysis above established cross-country regularities in circulation efficiency. This section turns the framework toward its intended use as a decision tool, applying it to a single economy (Georgia in 2021[4]) to illustrate how the National Index of Circulation distinguishes between policy initiatives that conventional activity measures would treat as broadly equivalent.
Table 1 Policy Simulation Scenarios
| Scenario | Scenario logic | Real-world mirror |
| S1 Public investment | A capital program entering through construction, linked utilities and domestic materials, with a slice for program administration. | A national infrastructure / roads program; donor-financed capital works (e.g. ADB- or World Bank-backed projects). |
| S2 Consumption support | Income support reaching households directly, with relief channeled through consumer-facing trade and hospitality. | A cost-of-living package: pension top-ups and targeted transfers combined with temporary VAT relief on consumer goods. |
| S3 Industrial / productivity | Concentrated in high-value-added, low-import knowledge and tradable activities. | An innovation / industrial-policy program: IT and BPO incentives, R&D and skills support, selective manufacturing upgrading. |
| S4 Tourism | Domestically produced services (lodging, food, transport, culture) with a local agricultural supply link. | A tourism-recovery and hospitality-support package, directly relevant to Georgia’s development strategy. |
| S5 Public services | Expansion of state-provided services: public administration together with public education and health. | A public-sector pay-and-staffing expansion; scaling up of schooling and primary healthcare. |
| S6 Agriculture (value-chain) | Agricultural support spread across the chain: farm-household income, inputs and processing, distribution and logistics. | An integrated rural-development program: input co-financing, agro-credit, and value-chain (processing/marketing) support. |
| S7 Agriculture (production-only) | Grants concentrated at the farm gate; the downstream value chain is deliberately not supported. | Production-only grants to medium and large farms to raise output, Georgia’s long-running agricultural support approach. |
We construct seven stylized initiatives (Table 1), each represented as an injection of identical total size distributed across the institutional actors and productive activities according to the spending profile of a recognizable policy archetype (injection structures are given in Table 2 below). The injection is set at 1% of Georgia’s GDP of 2021 (607.24 MGEL) so that the value-added multiplier of each initiative converts directly into the domestic value added it would generate. Because all seven inject the same total, their turnover and value multipliers are directly comparable, and the National Index of Circulation, being scale-invariant, reflects only the structural efficiency of each entry profile. The scenarios are illustrative archetypes intended to demonstrate the method; they are not proposals, and the results are a demonstration of how the framework would inform a decision, not a causal ranking of policies for Georgia.
Table 2 Policy Simulation Scenarios: Injection Structure, Georgia 2021
| Actor / activity | S1 Public investment | S2 Consumption support | S3 Industrial / productivity | S4 Tourism | S5 Public services | S6 Agriculture (value-chain) | S7 Agriculture (production-only) |
| G (government final consumption) | 0.15 | – | – | – | 0.45 | – | – |
| I (household final consumption) | – | 0.70 | – | – | – | 0.20 | – |
| Agriculture, forestry, fishing | – | – | – | 0.10 | – | 0.45 | 0.85 |
| Manufacturing | 0.10 | – | 0.25 | – | – | 0.15 | 0.10 |
| Electricity, gas, steam, AC | 0.10 | – | – | – | – | – | – |
| Water, sewerage, waste | 0.10 | – | – | – | – | 0.05 | – |
| Construction | 0.40 | – | – | – | – | – | – |
| Wholesale & retail trade | – | 0.20 | – | 0.15 | – | 0.10 | – |
| Transportation and storage | 0.15 | – | – | 0.20 | – | 0.05 | 0.05 |
| Accommodation and food service | – | 0.10 | – | 0.40 | – | – | – |
| Information and communication | – | – | 0.30 | – | – | – | – |
| Financial and insurance | – | – | 0.10 | – | – | – | – |
| Professional, scientific, technical | – | – | 0.25 | – | – | – | – |
| Administrative and support | – | – | 0.10 | – | – | – | – |
| Education | – | – | – | – | 0.275 | – | – |
| Human health and social work | – | – | – | – | 0.275 | – | – |
| Arts, entertainment, recreation | – | – | – | 0.15 | – | – | – |
| Total | 1.00 | 1.00 | 1.00 | 1.00 | 1.00 | 1.00 | 1.00 |
Note: Education and Human health (S5) are recorded in the SUTs as single activities blending public, cost-valued output with private, market-valued output; the publicly available data do not separate the two, so S5’s value-retention reading should be interpreted with that ambiguity in mind. The financial services share in S3 carries partly imputed (FISIM) value added.
The simulation uses Georgia’s observed 2021 expenditure structure. As the pre- versus post-pandemic stability analysis indicated that relative circulation positions changed only marginally between 2015 and 2021, the 2021-based results are unlikely to be artifacts of pandemic-period distortion.
Table 3 Simulation results, Georgia 2021 (injection = 607.24 mln GEL, 1% of GDP)
| Initiative | Turnover mult. | Value mult. | NIC | Value added created (mln GEL) | Turnover rank | Value rank | NIC rank |
| S1 Public investment | 2.70 | 1.05 | 0.39 | 637.6 | 2 | 3 | 6 |
| S2 Consumption support | 2.57 | 0.890 | 0.35 | 540.5 | 4 | 5 | 7 |
| S3 Industrial / productivity | 2.58 | 1.12 | 0.43 | 678.2 | 3 | 2 | 3 |
| S4 Tourism | 1.89 | 0.79 | 0.42 | 479.6 | 6 | 7 | 4 |
| S5 Public services | 3.32 | 1.52 | 0.46 | 921.9 | 1 | 1 | 2 |
| S6 Agriculture: value-chain support | 2.18 | 0.90 | 0.41 | 544.4 | 5 | 4 | 5 |
| S7 Agriculture: production-only grants | 1.88 | 0.887 | 0.47 | 539.0 | 7 | 6 | 1 |
| Benchmark: pure household injection | 2.71 | 0.84 | 0.31 | ||||
| Benchmark: pure government injection | 3.77 | 1.78 | 0.47 | ||||
| Benchmark: business aggregate | 2.35 | 0.98 | 0.41 | ||||
| Benchmark: pure Agriculture injection | 1.78 | 0.90 | 0.50 |
Source: Geostat supply and use tables (2021); IMF World Economic Outlook (GDP); author’s analysis. Value added created = value multiplier × 607.24 mln GEL. Pure-injection benchmarks are reported as reference points against which the mixed initiatives are read.
The central finding: activity ranking and value-retention ranking diverge sharply
The two rank columns in Table 3 are almost mirror images, and that divergence is the point of the exercise. The initiative generating the most gross activity is not the one retaining the most value, and in several cases the ordering reverses outright. Production-only agricultural grants (S7) generate the least gross circulation of any initiative (a turnover multiplier of 1.88, last in the table) yet retain the highest share of that circulation as domestic value (NIC 0.47, first in the table). Public investment (S1) is the reverse: second highest on activity (2.70) but sixth of seven on value retention. A decision-maker ranking these initiatives by the economic activity they stimulate would order them almost oppositely to one ranking them by value retained.
This is the paper’s thesis made operational: turnover and retained value are distinct dimensions, and an initiative can set substantial circulation in motion while leaving comparatively little domestic value behind — or generate little activity while retaining value efficiently. The reordering between the columns is precisely the diagnostic content the National Index of Circulation adds to a conventional multiplier appraisal.
In monetary terms — the form most useful to a policymaker — the divergence is concrete. On an identical 607.24 mln GEL program, the industrial/productivity initiative (S3) generates about 678 mln GEL of domestic value added, against about 540 mln GEL for consumption support (S2): a difference of roughly 140 mln GEL in retained value for the same outlay, traceable to S3’s higher circulation efficiency (NIC 0.43 against 0.35). Across the seven initiatives, the ranking by economic activity and the ranking by NIC are essentially unrelated (Spearman ρ = −0.18), and the ranking by total value created correlates only weakly with the NIC ranking (ρ = 0.11). Given the seven-scenario design these coefficients are descriptive rather than inferential; the point is not that the correlations are statistically distinguishable from zero but that they are low — were NIC merely a re-expression of the turnover or value multipliers, the rankings would largely coincide, and they do not.
The agriculture comparison: same sector, opposite delivery, divergent efficiency
The two agricultural initiatives isolate a delivery-design choice within a single policy domain, and they mirror an actual, long-running Georgian debate: support the whole value chain or pay farms to produce. The result is instructive. Integrated value-chain support (S6) and production-only grants (S7) generate almost identical total value added (544 vs 539 mln GEL), yet they sit at opposite ends of the activity and efficiency rankings. S6 sets more money in motion (turnover 2.18 vs 1.88) by activating downstream processing, logistics, and distribution; S7 concentrates injection at the farm gate and circulates less but retains a higher share of what it circulates (NIC 0.47 vs 0.41).
The interpretation requires care, because S7’s chart-topping NIC should not by itself recommend it. S7 retains a higher share of a smaller circulation: its high NIC reflects that primary agriculture in Georgia is a short, domestically-contained, low-import circulation path (high retention ratio, but low amplification) not that production-only grants create more value. Indeed, they create marginally less total value than value-chain support while generating substantially less economic activity. Which design is preferable therefore depends on the objective: if the goal is value-efficient retention per unit of circulation, S7; if the goal is broader activity and employment across the rural economy, S6; and on total value created the two are effectively equivalent. The framework does not pick the winner, it makes the trade-off explicit, which is exactly what a turnover-only or budget-only appraisal cannot do.
Why the highest-NIC initiative does not settle the ranking
S7 (production-only grants) records the highest NIC in the table, but a high index does not by itself make it the preferred policy, and the reason is intrinsic to the measure. S7 is also the lowest-turnover initiative, and NIC, as a ratio of value to circulation, rises when the denominator is small. Its high efficiency reflects a short, low-leakage but also low-amplification circulation path (money that stays domestic but does not travel far) rather than exceptional value creation; recall that S7 generates marginally less total value than S6 while setting far less activity in motion. Just as the highest-turnover initiative is not necessarily the most value-efficient, the highest-NIC initiative is not automatically the best policy. NIC is a structural accounting measure of how efficiently circulation converts to recorded value; it must be read alongside the turnover multiplier (how much activity is generated) and the value multiplier (how much value is created in total), never maximized in isolation.
Two interpretive cautions attach to specific scenarios. The public-services initiative (S5) tops the value and turnover measures, but its recorded value retention should be read with a measurement caveat that the data cannot fully resolve. Part of S5’s output is general government and public administration, which is non-market and valued in the national accounts at cost (compensation plus intermediate consumption plus consumption of fixed capital, with no operating surplus), so its measured value added is mechanically high. The education and health components, however, blend publicly-produced output with a substantial private, market-valued share (private universities, clinics, and schools) and the publicly available supply and use tables do not separate the two. S5’s value retention therefore mixes a cost-valuation component with genuine market value added in unknown proportion, and its position should be interpreted with that ambiguity in mind rather than taken at face value. A smaller, parallel caveat applies to the financial-services component of S3, whose value added is partly imputed (FISIM). In both cases the framework faithfully reports recorded value added; what it cannot do is disentangle market value from accounting imputation where the source data does not allow it.
Interpreting the spread
Across the seven initiatives NIC ranges from 0.35 to 0.47. This band is narrower than the spread across the pure injection benchmarks, and the compression is expected: realistic policy mixes draw on overlapping sets of productive activities and so cluster more tightly than stylized single-origin injections. The discriminating power of the measure at the policy-mix level is real but bounded. Even so, the range is economically meaningful, the gap between the least value-retentive market initiative (S2, NIC 0.35) and the most (S7, NIC 0.47) corresponds to roughly a third more domestic value per unit of circulation, and the monetary illustrations above show that at program scale these differences translate into hundreds of millions of GEL.
1.2. Dynamic Transmission of Circulatory Efficiency
Having shown how the framework discriminates between policy designs at a point in time, we now turn to a more tentative, exploratory question: whether changes in circulation efficiency are associated with subsequent growth. The results of this section are secondary to the structural and simulation findings above and should be read as suggestive rather than confirmatory. To evaluate this, we estimate a distributed-lag panel specification over horizons t through t+3 using log-difference transformations of both GDP per capita and NIC measures.
The estimating equation takes the form:

Where:
denotes country fixed effects,
year fixed effects,
,
- and interaction terms are included for below-median income economies.
The differenced specification reduces concerns associated with non-stationarity and persistent cross-country level effects, allowing the analysis to focus on structural changes in circulation efficiency rather than static differences in economic scale.
The results in Table 4 suggest substantial heterogeneity in the temporal association between circulation dynamics and growth across development groups.
For above-median economies, contemporaneous changes in business-led circulation efficiency exhibit a positive association with GDP growth (β=0.34, p<0.10), consistent with production systems characterized by relatively dense domestic linkages and rapid transmission of value-added effects. Given the same-year construction of the output weights underlying , this contemporaneous association should be read with particular caution, as it cannot be cleanly separated from the compositional response of output shares to the same-year shock; the lagged-horizon results, which are not subject to this simultaneity, carry the more interpretable weight.
By contrast, below-median economies display delayed temporal associations. Government-linked circulation efficiency becomes positively associated with growth at the one-year horizon, while household-linked circulation efficiency exhibits statistically significant positive interactions at intermediate horizons (t+2 and t+3). This pattern is consistent with the interpretation that domestic demand propagation mechanisms may play a larger medium-term role in this group of economies.
Table 4 Dynamic Transmission of injection-origin-specific Circulatory Efficiency on GDP Growth (t to t+3)[5]
| Relay_models.1 relay_models.2 relay_models.3 relay_models.4 Dependent Var.: d_gdp_0 d_gdp_1 d_gdp_2 d_gdp_3 d_NIC_B 0.3416* (0.1814) -0.1795 (0.1143) -0.1245 (0.1326) -0.0862 (0.1262 d_NIC_G 0.0440 (0.1111) -0.1227 (0.0822) 0.1734 (0.1235) 0.0763 (0.1379) d_NIC_I 0.0175 (0.0766) 0.0654 (0.0522) -0.0907* (0.0491) 0.0511 (0.0455) lower_wealth 0.0033 (0.0034) 0.0055 (0.0051) 0.0179** (0.0065) 0.0063 (0.0047) d_NIC_B x lower_wealth -0.2847 (0.2398) 0.1381 (0.1554) 0.0900 (0.2258) -0.0542 (0.1659) d_NIC_G x lower_wealth -0.0278 (0.2044) 0.1977* (0.1133) -0.2502 (0.1637) -0.1415 (0.1308) d_NIC_I x lower_wealth -0.0511 (0.0942) -0.1359 (0.1141) 0.1865** (0.0791) 0.1513** (0.0636) Fixed-Effects: —————- —————- —————– —————– COUNTRY Yes Yes Yes Yes YEAR Yes Yes Yes Yes ______________________ ________________ ________________ _________________ _________________ S.E.: Clustered by: COUNTRY by: COUNTRY by: COUNTRY by: COUNTRY Observations[6] 170 170 170 170 R2 0.83739 0.83840 0.83034 0.84674 Within R2 0.03938 0.03162 0.06947 0.05277Signif. Codes: 0 ‘***’ 0.01 ‘**’ 0.05 ‘*’ 0.1 ‘ ‘ 1 |
Source: Author’s analysis
The estimation sample comprises the 32 economies reporting at least two years of computable indices, yielding 170 country-year observations after “first-differencing”. Because the dependent variable is itself a first difference at each horizon, the leads do not trim the panel relative to the contemporaneous specification, and the observation count is therefore constant across the t through t+3 horizons.
Importantly, the explanatory contribution of NIC dynamics should be interpreted cautiously. While total model R2 values remain high due to the inclusion of country and year fixed effects, within-R2 values indicate that NIC dynamics explain a modest share of short-run within-country variation. Accordingly, the results are interpreted as evidence of structured temporal association rather than causal identification.
Conclusion
This study examined the empirical properties of the National Index of Circulation (NIC) across a panel of advanced and transition economies from 2011 to 2021. By shifting analytical attention from aggregate turnover volume toward the structural efficiency of domestic value propagation, the analysis provides a framework for distinguishing between economies that generate high levels of transactional activity and those that more effectively retain value within domestic circulation networks.
The results suggest that economic scale and circulation efficiency constitute analytically distinct dimensions of economic performance. Substantial dispersion in value-added generation across comparable levels of turnover indicates that the capacity to retain and recirculate value domestically differs meaningfully even among high-income economies. Economies with higher income levels tend to cluster along more efficient circulation configurations, implying that long-run development is associated not only with expanding economic activity, but also with qualitative improvements in domestic value-retention structures and intersectoral linkages.
Applied to Georgia, the framework demonstrates how this distinction operates as a practical decision tool. Across seven stylized initiatives of equal budget, the ranking by economic activity and the ranking by value retention proved almost mirror images: the initiative generating the most gross circulation was among the least value-retentive, while initiatives generating less activity retained more value per unit circulated. A pure household-consumption injection retained the least domestic value of any entry point, reflecting the import intensity of consumer demand; and within agricultural support, integrated value-chain and production-only designs generated nearly identical total value but sat at opposite ends of the activity and efficiency rankings, so that the choice between them turns on a value-retention dimension entirely invisible to conventional multiplier appraisal. The framework does not select a single best policy; it makes explicit a trade-off that activity-based or budget-based appraisal cannot.
This use of the framework carries a methodological caution. Neither the highest-turnover nor the highest-NIC initiative is automatically the preferred choice: a high turnover multiplier may reflect extensive but low-value circulation, while a high NIC may reflect a short, low-amplification circulation path that retains a large share of a small flow. NIC is therefore a diagnostic to be read alongside the scale of activity and the total value generated, not a single quantity to be maximized. Used in this way — as one of three jointly interpreted measures rather than an optimand — it adds a dimension of value retention to policy appraisal without displacing the conventional concern with economic scale.
The simulation should be understood as a demonstration of method, applied to a single country and year with illustrative injection profiles, rather than as a validated ranking of policies for Georgia; its contribution is the analytical distinction it makes visible, not a causal claim about which initiative is best.
The dynamic panel analysis further reveals heterogeneous temporal associations between sector-specific circulation efficiency and subsequent growth dynamics over short- and medium-term horizons. For above-median economies, changes in business-originating circulation efficiency are positively associated with growth outcomes, consistent with production systems characterized by relatively dense domestic linkages and rapid transmission of value-added effects. Below-median economies display differentiated temporal responses — government-linked circulation dynamics at shorter lags, household-linked efficiency at intermediate horizons — suggesting that domestic demand propagation mechanisms play a larger medium-term role in this group of economies.
These findings should be interpreted cautiously. The relatively modest within-R2 values are consistent with the broader macro-panel literature, where fixed effects absorb much of the persistent cross-country variation in economic performance. Accordingly, the empirical results are interpreted not as evidence of causal identification, but as indicative of structured temporal associations between circulation efficiency and growth dynamics. The contribution of the NIC framework therefore lies less in providing a deterministic growth model than in offering a structural lens through which differences in domestic value propagation and retention may be systematically compared across economies.
Within the limitations discussed in the methodology chapter, the analysis suggests that the composition, timing, and institutional origin of circulation dynamics may matter for understanding heterogeneous development trajectories even among advanced economies. More broadly, the findings support the view that long-run economic performance depends not only on the scale of economic activity, but also on the structural efficiency with which value circulates through and is retained within the domestic economy.
Bibliography
Baldwin, R. (2016). The great convergence: Information technology and the new globalization. Harvard University Press.
Blanchard, O., & Johnson, D. R. (2013). Macroeconomics (6th ed.). Pearson.
Charnes, A., Cooper, W. W., & Rhodes, E. (1978). Measuring the efficiency of decision-making units. European Journal of Operational Research, 2(6),, 429-444.
Defourny, J., & Thorbecke, E. (1984). Structural path analysis and multiplier decomposition within a social accounting matrix framework. The Economic Journal, 94(373), 111–136.
Johnson, R. C., & Noguera, G. (2012). Accounting for intermediates: Production sharing and trade in value added. . Journal of International Economics, 86(2), 224–236.
Keynes, J. M. (1936). The General Theory of Employment, Interest, and Money. Palgrave Macmillan.
Koopman, R., Wang, Z., & Wei, S.-J. (2014). Tracing value-added and double counting in gross exports. . American Economic Review, 104(2), 459–494.
Leontief, W. (1986). Input-Output Economics, Second Edition. Oxford University Press.
OECD. (2021). Economic Policy Reforms 2021: Going for Growth. OECD Publishing.
OECD. (2022). OECD Science, Technology and Industry Working Papers 2022/02: Guide to OECD TiVA, 2021 edition. OECD Publishing. doi:https://dx.doi.org/10.1787/58aa22b1-en
Porter, M. E. (1990). The competitive advantage of nations. Free Press.
Pyatt, G., & Round, J. (1985). Social accounting matrices: A basis for planning. World Bank.
Stern, N. (2006). The Stern review: The economics of climate change. HM Treasury.
Stiglitz, J. E., Sen, A., & Fitoussi, J.-P. (2009). Report by the Commission on the Measurement of Economic Performance and Social Progress. European Commision. Retrieved from https://ec.europa.eu/eurostat/documents/8131721/8131772/Stiglitz-Sen-Fitoussi-Commission-report.pdf
Tesfatsion, L., & Judd, K. L. (2006). Handbook of Computational Economics: Agent-Based Computational Economics. North-Holland.
Thorbecke, E. (2000). THE USE OF SOCIAL ACCOUNTING MATRICES IN MODELING. 26th General Conference. Cracow, Poland: The International Association for Research in Income and Wealth.
Tirole, J. (2017). Economics for the common good. Princeton University Press.
UN, Department of Economic and Social Affairs, Statistics Division. (2018). Handbook on Supply and Use Tables and Input-Output Tables with Extensions and Applications. New York: United Nations.
Walmsley, T. L., & Minor, P. J. (2020). The economic impact of the US-China trade war. Global Trade Analysis Project. Purdue University.
Wooldridge, J. M. (2010). Econometric analysis of cross section and panel data (2nd ed.). MIT Press.
Share this content: